Event Loop from the Inside: From Browser to Node.js
Part 1. Browser VS Server.
A Classic Interview Question
You've probably heard one of interviewers' favorite questions: "Tell me about the Event Loop in JavaScript." Usually, they mean the browser version of JavaScript. If you need a simple answer, it can go like this:
Event Loop is a mechanism that allows JavaScript, being single-threaded, to handle asynchronous operations. It works with the Call Stack and two task queues — the Microtask Queue (for microtasks) and the Task Queue (for macrotasks).
To put it simply, there are three types of operations:
- Synchronous code — executes immediately in the Call Stack.
- Microtasks — Promise.then(), run right after synchronous code.
- Macrotasks — setTimeout / setInterval, run last.
The order is easy to remember:
- Synchronous code first — it runs right now, no waiting.
- Microtasks next — for example, handling a backend response matters more than hiding a notification.
- Macrotasks last — for example, closing a notification via setTimeout.
That knowledge is already enough to confidently answer "What will be logged to the console, and in what order, when this code runs?".
Yes, there are other mechanisms in microtasks and macrotasks beyond Promise and setTimeout, and the Event Loop itself is more complex than it first appears. But this is enough for now.
Why Do We Need a Loop?
At a high level, the Event Loop solves an important problem — it allows asynchronous execution of operations in single-threaded JavaScript, creating the illusion of multithreading.
Imagine we have a web server that handles incoming HTTP requests. For example, when a request hits a certain API route, the server queries the database and returns the result.
Without an asynchronous execution mechanism, while the server waits for the database response, it would be blocked — unable to handle other requests, even if the CPU is idle.
What are the options for solving this problem?
- Multithreading — the approach used by Apache. It could create a separate process or thread for each request. The more requests, the more resources spent maintaining those processes/threads, which quickly hit memory limits.
- Non-blocking I/O — the approach that Nginx is based on, and essentially what the Event Loop in JavaScript is. Instead of creating separate threads, operations execute asynchronously, and when one task is "waiting" (e.g., for data to load), the CPU can work on other tasks.
What is the fundamental difference?
Resources are consumed in both cases, but the difference is what they're spent on. With the multithreaded approach, a massive amount of RAM goes toward keeping thousands of sleeping threads alive, waiting for responses (from files, databases, or the network), while the CPU wastes cycles switching between them (context switching). With the non-blocking approach, a single thread doesn't sit idle waiting: it registers an event and immediately switches to useful work on another request. Resources go toward actual work, not toward maintaining the wait.
The Event Loop makes this possible by managing task queues and freeing up the main thread to execute other operations. This allows, in particular, a Node.js server to handle thousands of connections simultaneously, even though it formally operates in single-threaded mode.
How Does the Node.js Event Loop Differ from the Browser Event Loop?
We've covered how the Event Loop works in the browser. Now it's time to look at it in Node.js.
The basic principles are similar: there's synchronous code, macro- and microtasks. But the differences start with how macrotasks are processed — in Node.js they go through six phases instead of one general queue.
Here is the sequence of these phases:
- Timers — callbacks scheduled via
setTimeout()andsetInterval()are executed. - Pending Callbacks — callbacks of operations delayed for system reasons (e.g., TCP errors) are executed.
- Idle, Prepare — an internal phase of the V8 engine.
- Poll — the main I/O phase: I/O operations run here (
fs.readFile, network requests, etc.). If there are no more tasks ahead, the Event Loop can pause here and wait for new events. - Check —
setImmediate()callbacks are executed. - Close Callbacks — close callbacks are handled (
socket.on('close')).
But that's not all. After each of these phases, the microtask queue runs — Promise.then(), queueMicrotask(), and also… the mysterious process.nextTick(), which is not a microtask at all and runs before them.
Six phases, microtasks, nextTick() — how do you memorize all this and understand what runs when? Let's figure it out.
The Order of Phases in the Event Loop
First, let's set aside the two less interesting phases for us — "Pending Callbacks" and "Idle, Prepare". They rarely appear in real-world scenarios, so let's focus on the four key phases that you can actually observe in code.
Let's walk through exactly how Node.js moves through these phases using a concrete example:
const fs = require("fs");

console.log("🟢 1. Start of synchronous code");

// 🔹 Microtasks and nextTick
process.nextTick(() => console.log("⚡ nextTick"));
Promise.resolve().then(() => console.log("⚡ Promise.then"));

// 🔹 Timer (Timers Phase)
setTimeout(() => console.log("⏳ setTimeout (Timers Phase)"), 0);

// 🔹 setImmediate (Check Phase)
setImmediate(() => console.log("⏩ setImmediate (Check Phase)"));

// 🔹 I/O operation (Poll Phase)
fs.readFile(__filename, () => {
  console.log("📂 fs.readFile (Poll Phase)");
});

// 🔹 Close event (Close Callbacks Phase)
const readable = fs.createReadStream(__filename);
readable.close();
readable.on("close", () => console.log("🚪 onClose (Close Callbacks Phase)"));

console.log("🟢 2. End of synchronous code");
This code produces the following output order:
🟢 1. Start of synchronous code
🟢 2. End of synchronous code
⚡ nextTick
⚡ Promise.then
⏳ setTimeout (Timers Phase)
⏩ setImmediate (Check Phase)
🚪 onClose (Close Callbacks Phase)
📂 fs.readFile (Poll Phase)
Key things to notice here:
- All synchronous code runs first, before the Event Loop even starts.
- After that, microtasks and
nextTickare processed:process.nextTick()— this is the highest-priority queue, it runs first.Promise.then()— a microtask, runs immediately afternextTick.
- Only then does the Event Loop itself start, passing through the main phases.
To make the process easier to follow, let's present it as a table:
| Event Loop Phase | Iteration 1 | Iteration 2 |
|---|---|---|
| Timers Phase (setTimeout 0) | ✔ | |
| Poll Phase (I/O, fs.readFile) | ✔ | |
| Check Phase (setImmediate) | ✔ | |
| Close Callbacks Phase (onClose) | ✔ |
Phases and key iterations of the Event Loop
Why did Poll Phase (fs.readFile()) end up in the second iteration?
Because Node.js needs time to read the file, and this operation doesn't finish in time for the first Event Loop iteration.
Why did onClose() run in the first iteration?
Because readable.close() was called during synchronous code execution, so onClose() was already ready to run in the Close Callbacks Phase.
Now let's make our example more complex. Let's add a few new operations inside the fs.readFile() callback:
// 🔹 I/O operation (Poll Phase)
fs.readFile(__filename, () => {
  console.log("📂 fs.readFile (Poll Phase)");

  setTimeout(() => console.log("⏳ setTimeout inside fs.readFile"), 0);
  setImmediate(() => console.log("⏩ setImmediate inside fs.readFile"));
  process.nextTick(() => console.log("⚡ nextTick inside fs.readFile"));
});
The output order will be:
🟢 1. Start of synchronous code
🟢 2. End of synchronous code
⚡ nextTick
⚡ Promise.then
⏳ setTimeout (Timers Phase)
⏩ setImmediate (Check Phase)
🚪 onClose (Close Callbacks Phase)
📂 fs.readFile (Poll Phase)
⚡ nextTick inside fs.readFile
⏩ setImmediate inside fs.readFile
⏳ setTimeout inside fs.readFile
What changed:
- All previous operations execute in the same order as before.
- A new
nextTickwas added, which runs immediately afterfs.readFile(), but before any other operations in that callback. setImmediate()insidefs.readFile()runs beforesetTimeout(), because the Check Phase comes before the Timers Phase.
Let's update the phase table:
(Event Loop phases and key iterations in the updated example)
| Event Loop Phase | Iteration 1 | Iteration 2 | Iteration 3 |
|---|---|---|---|
| Timers Phase (setTimeout 0) | ✔ | ✔ | |
| Poll Phase (I/O, fs.readFile) | ✔ | ||
| Check Phase (setImmediate) | ✔ | ✔ | |
| Close Callbacks Phase (onClose) | ✔ |
Why did nextTick inside fs.readFile() fire immediately?
Because process.nextTick() doesn't depend on the Event Loop phases. It runs right after the current callback (in this case, the fs.readFile callback), before moving to the next phase of the cycle or executing any remaining microtasks.
Conclusions
We've established that the Event Loop is the heart of asynchrony in JavaScript — it lets us avoid blocking code execution and process tasks in the right order. We dove into the differences between the browser Event Loop and Node.js, and walked through the Event Loop phases with examples, understanding in what order timers, I/O callbacks, setImmediate, and other important things execute.
However, we haven't touched on a ton of interesting topics, for example:
- What does
libuvdo and how does it relate to the Event Loop? - Can we really predict the order of code execution in all cases?
- What happens in the "Pending Callbacks" and "Idle, Prepare" phases?
- When does Node.js have time to read files if the Poll Phase only processes ready I/O events?
- How do Node.js servers work, and is it true that if one request hangs, the whole server will freeze and stop accepting others?
- If Node.js is single-threaded, how does it work on multi-core computers?
- And can Node.js be made truly multi-threaded?
The Event Loop, and Node.js itself, is a deep topic — and we've only just begun exploring its mechanics.
Part 2. Event Loop Nuances.
Predicting the Order of Execution
It might seem that since Event Loop phases follow each other strictly, the order of code execution should be easy to predict. But that's not always the case.
One example is setTimeout(0) and setImmediate().
setTimeout(() => console.log("⏳ setTimeout"), 0);
setImmediate(() => console.log("⏩ setImmediate"));
Intuitively, you might think setTimeout(0) would fire first, since the Timers Phase comes first. However, if you run this code, the result can vary from run to run:
⏳ setTimeout
⏩ setImmediate
or
⏩ setImmediate
⏳ setTimeout
Why does this happen?
The Event Loop passes through phases in the following order:
Timers → Pending Callbacks → Idle, Prepare → Poll → Check → Close Callbacks
setTimeout(0)runs in the Timers Phase, which fires at the start of a new Event Loop iteration.setImmediate()runs in the Check Phase, which comes right after Poll.
But for setTimeout(0) to enter the execution queue, the system needs a small amount of time. If the Event Loop has already moved to Poll and finds no more tasks, it immediately proceeds to the Check Phase, where setImmediate() runs. And setTimeout(0), if it didn't get processed in the first iteration, will wait for the next cycle.
This also means that the delay in setTimeout() is not a guaranteed execution time — it is the minimum waiting time before the callback runs.
However, if you run those same operations inside an I/O callback, the order is always predictable:
fs.readFile(__filename, () => {
  setTimeout(() => console.log("⏳ setTimeout"), 0);
  setImmediate(() => console.log("⏩ setImmediate"));
});
When code executes inside an I/O callback, the Event Loop is already in the Poll Phase. After the Poll Phase is processed, the Check Phase always comes next (where setImmediate() runs), and only then, in the next iteration, the Timers Phase (setTimeout(0)).
What Actually Happens in the "Pending Callbacks" and "Idle, Prepare" Phases
Earlier we skipped over these two phases, but now let's figure out what role they play in the Event Loop.
The Pending Callbacks phase runs immediately after the Timers Phase and before the Idle, Prepare Phase. Its main purpose is to process deferred system callbacks that don't belong to timers or I/O, but need to be executed in the nearest cycle. It's essentially a buffer for events that can't be processed in the Poll Phase. Without it, errors could be lost or execute with a delay. For example, TCP/UDP connection errors land here.
An example of code where you can see this phase in action:
const fs = require("fs");
const net = require("net");

console.log("🟢 1. Start of synchronous code");

// 🔹 TCP connection error (Pending Callbacks Phase)
const socket = net.connect(9999, "127.0.0.1"); // Does not exist
socket.on("error", () => console.log("📌 Pending Callbacks Phase: TCP error"));

// 🔹 setTimeout (Timers Phase)
setTimeout(() => console.log("⏳ setTimeout (Timers Phase)"), 0);

// 🔹 setImmediate (Check Phase)
setImmediate(() => console.log("⏩ setImmediate (Check Phase)"));

// 🔹 I/O operation (Poll Phase)
fs.readFile(__filename, () => {
  console.log("📂 fs.readFile (Poll Phase)");
});

// 🔹 Stream close (Close Callbacks Phase)
const readable = fs.createReadStream(__filename);
readable.close();
readable.on("close", () => console.log("🚪 onClose (Close Callbacks Phase)"));

console.log("🟢 2. End of synchronous code");
The output order will be:
🟢 1. Start of synchronous code
🟢 2. End of synchronous code
⏳ setTimeout (Timers Phase)
📌 Pending Callbacks Phase: TCP error
⏩ setImmediate (Check Phase)
🚪 onClose (Close Callbacks Phase)
📂 fs.readFile (Poll Phase)
As you can see, the TCP error fires after the Timers Phase but before all other phases.
The Idle, Prepare phase is a technical phase in the Event Loop — or rather, two phases that are often discussed as one. They run immediately after Pending Callbacks, before the Poll Phase, and are used exclusively inside the Node.js engine. You can't directly register callbacks in them, which is why they're rarely mentioned.
- Idle Phase handles waiting for new tasks when there's nothing yet in the Poll Phase.
- Prepare Phase is used to prepare events before the Poll Phase, such as scheduling future I/O operations.
These phases remain "behind the scenes" of Node.js, but they play an important role in how the Event Loop manages asynchrony.
Why process.nextTick() Exists
We've already established that process.nextTick() is a mechanism that lets you execute code immediately after the current execution completes, but before entering the Event Loop. It even has higher priority than microtasks. But if we already have Promise.then() and setImmediate(), why do we need yet another way to defer execution?
At first glance, Promise.then() also runs before macrotasks, and it might seem usable as a substitute for nextTick(). However, in Node.js there are tasks that require execution strictly before any other operations — for example, error handling. If an error occurs inside an async function, its handler should run before any other tasks to prevent an incorrect program state. process.nextTick() guarantees that this code runs before any other operations, even if Promise.then() is already queued. If error handling were scheduled via microtasks, it could execute after other async operations, which in some cases could lead to hard-to-track bugs.
Another important use case for process.nextTick() is server applications. For instance, when we call server.listen(), the server may instantly bind to a port and start accepting connections. At this point, the "listening" event handler may not have been called yet. If a client connects right after startup, there's a chance "connection" could fire before "listening", which seems illogical.
Example:
const net = require("net");

const server = net.createServer();

server.listen(8080);

server.on("listening", () => {
  console.log("👂 Server is running and listening on port 8080");
});

server.on("connection", (conn) => {
  console.log("🔗 New connection!");
});
In this code, if the Event Loop enters the Poll Phase before "listening" is processed, the server might already have accepted a connection. This could cause "connection" to fire before we know the server is running.
We might get this strange output:
🔗 New connection!
👂 Server is running and listening on port 8080
Using process.nextTick() for the "listening" handler guarantees the server correctly announces its startup before it starts processing connections.
How to Freeze Node.js
Despite the convenience of process.nextTick(), it can't be used too freely, because it can block the Event Loop. If you keep scheduling new process.nextTick() calls inside an already-running callback, the Event Loop will never reach the next phases, and the code will simply hang:
function infiniteTick() {
  console.log("⚠ Infinite nextTick");
  process.nextTick(infiniteTick);
}

infiniteTick();
This code will hang because process.nextTick() runs before any other phases, and the Event Loop will never move forward.
That's why process.nextTick() should be used consciously, only in situations where Promise.then() or setImmediate() don't achieve the desired effect.
It's also worth noting that process.nextTick() is absent in the browser, and for an important reason. Unlike Node.js, the browser's Event Loop manages not just JavaScript execution, but also UI rendering, user event handling, and other critical tasks. If browsers supported process.nextTick(), developers could accidentally block the interface by calling nextTick() infinitely. This would make the page completely unresponsive, as the Event Loop would be unable to switch to rendering. In browsers, microtasks fill this role — they run before macrotasks but don't block UI updates.
Conclusions
In the second part we dove into more complex aspects of the Event Loop and examined situations where the order of code execution may be less obvious than it appears. We figured out why setTimeout(0) and setImmediate() sometimes swap places, how the Pending Callbacks and Idle, Prepare phases actually work, and why browsers don't have process.nextTick().
We also saw that process.nextTick() is not just a higher-priority microtask, but a tool that's critically important for correct code execution order in Node.js. It can be used to properly handle errors, manage server connections, and guarantee that important code executes before entering the Event Loop.
There are still many interesting topics waiting behind the scenes. The deeper we go into the Event Loop, the more questions arise. But that only makes learning Node.js even more interesting.
Part 3. Beyond the Event Loop.
What is libuv
Up until now we've been talking about the Event Loop as some magical mechanism that lets Node.js execute async code. But in reality, JavaScript itself can't read files or listen on ports. All of that is handled by libuv — a C library hiding under the hood of Node.js that does all the dirty work.
libuv is what implements the Event Loop, and it also takes care of a host of other things: the file system, network connections, DNS, async I/O, and even multithreading. All of this works transparently: we write async JS code, and libuv under the hood figures out when, where, and with which thread to process an operation.
And the "magic" of fs.readFile() not blocking execution and just calling a callback a few milliseconds later — that's libuv at work, which we'll get into shortly.
In a sense, libuv is the "engine" that drives the Event Loop and is responsible for everything that happens outside of JavaScript itself. Without it, Node.js wouldn't be asynchronous. Now that we understand how the Event Loop is structured at a high level, it's time to look a little deeper — into where everything actually turns.
When Does Node.js Have Time to Read Files
We've seen that Event Loop phases process the results of I/O operations — for example, the fs.readFile() callback fires in the Poll Phase when the data is already ready. But when does the actual file reading happen? After all, there's no "reading phase" in the cycle, and we don't see any disk access explicitly in the Event Loop.
In reality, that's not the Event Loop's job — libuv handles it instead. When we call fs.readFile(), Node.js doesn't start reading the file in the current thread. Instead, the task is sent to a background thread pool, where the reading actually happens. When the operation completes, the result is "returned" to the Event Loop — and only then does the callback fire.
The thread pool is a set of background threads that Node.js uses to execute heavy tasks outside the main thread. When a file needs to be read, a hash computed, or data compressed, the task is sent to one of the pool's threads.
This way, all the heavy work happens in parallel, and the Event Loop only processes the "ready!" notification. This allows JS code to remain unblocked and continue executing other tasks while a file is being read somewhere in the background.
What Else Works the Same Way?
It's not just file operations that go to the background. Here's a list of built-in modules whose tasks also go into the thread pool:
fs.*— reading and writing files (readFile,writeFile,stat, etc.);zlib.*— data compression and decompression (gzip,deflate,gunzip, etc.);crypto.pbkdf2,crypto.scrypt— resource-intensive cryptographic operations;dns.lookup— resolving domain names to IP addresses.
How Many Background Threads Are There?
By default — 4. This means that if we simultaneously launch crypto.pbkdf2() 10 times, the first 4 will execute right away, and the rest will queue up:
const crypto = require("crypto");

const start = Date.now();

function runTask(id) {
  crypto.pbkdf2("password", "salt", 100_000, 64, "sha512", () => {
    const time = Date.now() - start;
    console.log(`🔐 Task ${id} completed in ${time} ms`);
  });
}

// Launch 10 heavy tasks
for (let i = 1; i <= 10; i++) {
  runTask(i);
}
Default output:
🔐 Task 1 completed in 31 ms
🔐 Task 2 completed in 37 ms
🔐 Task 4 completed in 37 ms
🔐 Task 3 completed in 37 ms
🔐 Task 5 completed in 62 ms
🔐 Task 7 completed in 64 ms
🔐 Task 6 completed in 64 ms
🔐 Task 8 completed in 68 ms
🔐 Task 9 completed in 91 ms
🔐 Task 10 completed in 92 ms
Here we can see tasks completing in groups (pools of 4), with a delay between them.
The thread limit can be changed via an environment variable: UV_THREADPOOL_SIZE=8 node app.js.
Now 8 tasks will execute simultaneously — and the console output will be denser (in groups of 8):
🔐 Task 7 completed in 35 ms
🔐 Task 8 completed in 41 ms
🔐 Task 5 completed in 43 ms
🔐 Task 3 completed in 44 ms
🔐 Task 6 completed in 46 ms
🔐 Task 1 completed in 48 ms
🔐 Task 4 completed in 50 ms
🔐 Task 2 completed in 54 ms
🔐 Task 9 completed in 67 ms
🔐 Task 10 completed in 71 ms
The value can be raised up to 1024, but in most cases 8–16 is more than enough. The key thing to remember is that the thread pool is not infinite and shouldn't be overloaded.
It's worth noting that the order in which tasks complete may not match the order they were started. This is because operations execute in parallel across different threads, and the exact completion time depends on many factors — system load, thread startup specifics, internal task distribution. As a result, some tasks started later may finish sooner. This is normal and expected behavior for multithreaded processing.
What About Multi-Core Processors?
Node.js is traditionally considered single-threaded because all JavaScript code runs in a single thread — inside the Event Loop. But that doesn't mean it can't leverage the power of multi-core systems.
First, libuv uses a thread pool for heavy operations (file reading, cryptography, compression), and each thread in that pool can run on its own core. So parallel work is already happening — just not in the JS code itself.
Second, Node.js provides its own tools for parallelizing tasks: cluster and worker_threads. Each such thread can also run on a separate core.
In the end, Node.js does use multiple cores, and in some cases we can even control this ourselves.
How Not to Block Node.js
If you start heavily loading the thread pool with intensive tasks or use synchronous methods, you can easily block the Event Loop or make tasks wait too long.
Here are some practical recommendations based on the official Node.js documentation:
- Avoid synchronous methods from the
fs,crypto,zlibmodules, especially in code that handles incoming requests. For example,fs.readFileSync()can freeze the entire server until it finishes reading the file. - Don't launch too many heavy operations simultaneously, especially if they go into the thread pool. For example, dozens of
crypto.pbkdf2()orzlib.gzip()calls in one loop will fill the queue and some tasks will simply wait for a thread to free up. - Increase the pool size if the task genuinely requires parallel processing of a large number of I/O operations. This can be done via the
UV_THREADPOOL_SIZEvariable. However, more is not always better — every additional thread comes with additional overhead.
It's also worth being careful with regular expressions and JSON.parse(). They execute synchronously, directly in the main thread, and if a regex is too complex or JSON is too large — the Event Loop will stall. This becomes especially critical when such operations appear in code that handles user requests.
And this brings us to a separate category of problems — not just about performance, but about security as well.
What is ReDoS and How It Can Take Down a Server
ReDoS (Regular Expression Denial of Service) is an attack in which an adversary sends a specially crafted string that causes extremely slow regex processing. Running such a regex in the main thread leads to blocking the entire Node.js server.
Example:
// Vulnerable regex
const regex = /(a+)+$/;
const input = "aaaaaaaaaaaaaaaaaaaaaaaaaaaaaaaaaaaaaaaaaaaaaaaaaaaaaaaaaaaaaaaaaaaaX";

input.match(regex); // may hang
This code looks fine at first glance, but once you add an "X" at the end of the string, the regex engine starts endlessly iterating through all possible matching paths to figure out why X doesn't match. The longer the string, the longer it "thinks."
All of this happens directly inside the Event Loop, which gets blocked and can no longer process other requests, timers, or events.
How to protect against ReDoS:
- Avoid regexes with nested quantifiers, especially
(a+)+,(.*)+,(.+)+and similar patterns. - Validate user input in advance if it will be used in a regular expression.
- Limit the size of input data — this applies to both JSON and strings.
- Use tools to check for potentially dangerous patterns.
- When in doubt — don't use a regex at all, and instead process data via index-based search,
split, etc.
Even though in this section we were primarily talking about thread pool operation, it's important to remember: all tasks in Node.js start from the Event Loop. And if the Event Loop hangs — no threads will help, no timers will fire, the server won't accept new connections. Nothing will happen. That's why protecting the Event Loop isn't just a good practice. It is critically important when working with Node.js.
Conclusions
In this part we looked under the hood of the Event Loop and truly met libuv for the first time — the library that makes asynchrony possible in Node.js. We found that the Event Loop itself doesn't read files, encrypt data, or make requests — it only coordinates task execution, passing them to the thread pool, which operates in parallel.
We saw on real examples how fs.readFile, crypto.pbkdf2 and other built-in modules go into the background queue, and why only 4 such tasks execute simultaneously. And we looked at what can go wrong if you max out that pool. We also broke down why even a single heavy synchronous operation can "freeze" the entire application, and how this relates to the ReDoS attack, where a hastily written regex can take down an entire server.
The most important takeaway that becomes clear: even with the thread pool and background processes, the Event Loop remains the heart of the application. It launches tasks, accepts connections, handles events. And if it hangs — everything else stops.
Part 4. HTTP Server.
How a Node.js Server Works
When we write:
const http = require('http');

const server = http.createServer((req, res) => {
  res.end('Hello, world!');
});

server.listen(3000);
…it seems like Node.js simply calls our function whenever someone knocks on the port. But in reality, it goes a little deeper.
Calling http.createServer() is just a wrapper around net.createServer() — we're actually working with a plain TCP connection. Node.js then parses the headers itself, assembles req and res, and passes them into our callback. But the same example can be implemented like this:
const net = require('net');

const server = net.createServer((socket) => {
  socket.write('HTTP/1.1 200 OK\r\n');
  socket.write('Content-Type: text/plain\r\n');
  socket.write('Content-Length: 13\r\n');
  socket.write('\r\n');
  socket.write('Hello, world!');
  socket.end();
});

server.listen(3000);
Here we respond using the HTTP protocol ourselves — just sending a string. This is still TCP, just in manual mode and without the familiar req and res.
Who Actually Watches the Port?
When we call server.listen(), Node.js passes the port to the libuv library, which handles all the I/O magic. It registers a socket with the system and says: "OS, tell me when someone knocks on this port." Different operating systems use different system calls for this.
Node.js itself doesn't "listen" manually — it simply waits for a signal from the OS that a connection has arrived.
So Which Event Loop Phase Does the Server Operate In?
When a connection arrives, Node.js adds its processing to the Event Loop — not immediately, but in a queue. This means all nextTick and Promise callbacks scheduled earlier will execute first, and the HTTP request will wait its turn in the poll phase.
Even inside a request handler, all microtasks and process.nextTick go into their own queue and execute after the main synchronous part. In other words, all the code in the handler body runs first, and then everything that was deferred.
For example:
const http = require('http');

http.createServer((req, res) => {
  console.log('start');

  process.nextTick(() => {
    console.log('nextTick');
  });

  Promise.resolve().then(() => {
    console.log('promise');
  });

  console.log('end');
  res.end('ok');
}).listen(3000);
When a request comes in, the output will be:
start
end
nextTick
promise
This means that microtasks inside a request don't "interrupt" its execution either. Synchronous code runs first, and only then comes the microtask queue.
What happens if a client sends a request and the server starts doing something heavy? What will the other clients experience? Let's find out.
Stream-Based Data Processing and Event Loop Blocking
When an HTTP request arrives in Node.js, the req and res objects are streams. This means data arrives and is sent in chunks, not loaded and processed all at once. This approach makes efficient use of memory and avoids blocking the Event Loop.
However, if a heavy synchronous operation is executed inside a request, it can completely halt the processing of all other requests. Node.js operates in a single thread by default, and while a heavy operation is running, the Event Loop can't move to the next event.
For example, if you create this server:
const http = require('http');

function heavySyncWork() {
  const end = Date.now() + 5000;
  while (Date.now() < end) {}
}

http.createServer((req, res) => {
  if (req.url === '/block') {
    heavySyncWork();
    res.end('Done with blocking work');
  } else {
    res.end('Hello!');
  }
}).listen(3000);
and send a request to /block, the server will stop responding to any other incoming requests for five seconds. Even if another client hits /, they won't get a response until heavySyncWork finishes. All requests are handled in one Event Loop, and while it's busy, the queue just waits.
There's another way to cause blocking — using process.nextTick(). This mechanism lets you execute tasks before moving to the next Event Loop phase, but if used incorrectly, it can cause a freeze.
http.createServer((req, res) => {
  if (req.url === '/tick') {
    function infiniteTick() {
      process.nextTick(infiniteTick);
    }
    infiniteTick();
    res.end('Never reached');
  } else {
    res.end('Still alive');
  }
}).listen(3000);
In this example, infiniteTick never lets the Event Loop move to the next phase. The result: the first request to /tick won't even return "Never reached" (because the Event Loop is stuck on microtasks), and then the server hangs completely.
To avoid such situations, Node.js specifically recommends using stream-based data processing. It allows handling large volumes of data without blocking the Event Loop and without needing to load everything into memory at once. Example — sending a large file to a client:
const fs = require('fs');
const http = require('http');

http.createServer((req, res) => {
  const readStream = fs.createReadStream('./bigfile.txt');
  readStream.pipe(res);
}).listen(3000);
The file is read and sent in chunks. This approach avoids delays and allows other requests to be handled in parallel, even if the file is very large.
Why Timeouts Matter
Node.js allows keeping a connection with a client open for as long as needed. This is convenient for slow clients and for connection reuse, but at the same time it's a risk for the server.
If a client connects but doesn't send data, or sends it very slowly, Node.js will keep the connection open, consuming resources. Without explicit limits, such connections can hang indefinitely.
Node.js uses keep-alive behavior by default — meaning a connection after a response isn't closed immediately, but stays open waiting for new requests from the client. This saves resources on re-connecting, but under high load it can become a problem.
Example:
const http = require('http');

const server = http.createServer((req, res) => {
  setTimeout(() => {
    res.end('done');
  }, 10000); // respond after 10 seconds
});

server.listen(3000);
If dozens of clients connect to such a server, open a connection, and don't wait for a response, those connections will linger. Each one consumes some resources: a file descriptor, memory, a slot in the queue. Over time this can lead to a denial of service for new requests.
To prevent this, you should set timeouts:
server.setTimeout(5000); // close the connection if no activity for 5 seconds
req.setTimeout(3000);    // client is taking too long to send the request body
res.setTimeout(5000);    // delay when forming the response
You can also disable keep-alive if the server isn't designed for connection reuse:
res.setHeader('Connection', 'close');
What If You Don't Set Timeouts at All?
In theory — the connection can hang indefinitely. In practice, it might be closed by:
- the client itself (e.g., the browser);
- the OS at the TCP level;
- a proxy or load balancer (e.g., nginx).
But all of these are external factors that can't be relied upon. Some routers may keep connections open for 10 minutes, others drop them after 30 seconds. Under load, even 10–20 such "hanging" connections without timeouts can drain resources and interfere with serving new requests.
So it's safer to set timeouts explicitly — at the server, req, res level, and if necessary, add limits on the load balancer side.
Error Handling on the Server
If an unhandled error occurs inside an HTTP request handler in Node.js, it can cause the entire process to crash. Node.js doesn't wrap the http.createServer callback in try/catch — the developer is expected to control possible failures. As a result, any uncaught exception will terminate the server.
Example:
http.createServer((req, res) => {
  if (req.url === '/crash') {
    throw new Error('Something went wrong');
  }

  res.end('OK');
}).listen(3000);
Requesting /crash will terminate the process with an error. To prevent this, wrap the request handler in try/catch:
http.createServer((req, res) => {
  try {
    if (req.url === '/crash') {
      throw new Error('Something went wrong');
    }

    res.end('OK');
  } catch (err) {
    console.error('Request error:', err);
    res.statusCode = 500;
    res.end('Internal Server Error');
  }
}).listen(3000);
Things get tricky with async code — if an error occurs inside a Promise or an async function, it won't be caught by an outer try/catch. To handle this correctly, you need to explicitly add .catch:
http.createServer((req, res) => {
  (async () => {
    if (req.url === '/crash') {
      throw new Error('Async error');
    }

    res.end('OK');
  })().catch(err => {
    console.error('Async error:', err);
    res.statusCode = 500;
    res.end('Internal Server Error');
  });
}).listen(3000);
In complex projects with many routes, it's convenient to use frameworks that provide centralized error handling. But even in a simple server, it's important to remember that a single throw without a catch can stop the entire application.
Server Frameworks
Many frameworks hide the http.createServer internals, but under the hood everything works the same way. Express, for example, simply wraps the standard HTTP server and builds a chain of middleware that's called sequentially.
Async middleware in Express does work with await, and if promises are used correctly, the Event Loop isn't blocked. But it's not magic — await simply pauses execution of the current function until the promise resolves. During this time the Event Loop can process other events. If, however, a middleware contains a heavy synchronous operation like while (true) {}, the Event Loop will still be blocked.
Example:
app.get('/block', (req, res) => {
  while (true) {} // server hangs
});

app.get('/async', async (req, res) => {
  await new Promise(resolve => setTimeout(resolve, 1000));
  res.send('OK');
});
In the second case, the server calmly continues serving other requests while waiting. In the first — it freezes completely.
NestJS runs on top of Express (or Fastify) and uses the same middleware and controller principles, but adds layers of abstraction, dependency injection, and declarative error handling. By default, NestJS already catches exceptions in controllers and can return a proper 500 status without crashing the server.
It's important to understand that NestJS doesn't make the Event Loop "magical." If a blocking operation happens inside a controller, the behavior is the same as in Express — no framework can bypass Node.js's execution model.
Frameworks simplify code structure, make error handling more predictable, and help avoid missing important details. But the foundation remains the same: one Event Loop, one thread, and responsibility for performance lies with the application.
Conclusions
In this part we figured out how Node.js handles incoming HTTP requests and what's under the hood. We looked at how http.createServer relates to TCP and the Event Loop, and why each request isn't an instant action, but an event in a shared queue.
We explored how streams help process data without blocking, and why heavy synchronous operations can hang the server. We talked about the importance of timeouts and what happens if you don't set them. We covered error handling and how a single throw can stop the entire process. And at the end — we looked at how Express and NestJS deal with all of this, and why frameworks don't cancel the fundamental Node.js execution model.
Part 5. True Multithreading.
In all previous parts we've already noted that the Event Loop in Node.js runs in a single main thread. At the same time, some operations — like reading files — can run in the thread pool, a special pool of threads where Node.js sends heavy tasks.
But despite this, all of our JavaScript code, as well as key operations like request handling, execute strictly in one thread. That's precisely why Node.js is called single-threaded — at least from the application's perspective.
However, in reality it does have ways to break out of a single thread. That's exactly what we'll talk about today.
Why Multithreading in Node.js
Node.js was originally built to handle many simultaneous I/O requests — network or file-based, for example. It's good at this: one thread, non-blocking code, fast responses. But as soon as a heavy synchronous task appears inside that thread, it's over — the Event Loop stalls, the server freezes, users wait.
To deal with this, even from the early versions of Node.js the core included the child_process module. With it, you could launch external commands and third-party scripts — for example, a shell script or python your_script.py. However, communication with these processes was quite limited (stdin and stdout), and everything came down to strings and parsing.
Then the fork method appeared, and it was specifically designed for launching other Node.js scripts. The key difference — the ability to establish two-way communication between parent and child via IPC — inter-process communication. This means you can pass JavaScript objects using process.send() and receive them on the child side. This is already starting to look like how you'd want to build multithreading: delegate a heavy task to a "second process" and not block the main thread.
Example:
// main.js
const { fork } = require('child_process');
const worker = fork('./worker.js');

worker.send({ action: 'compute', value: 42 });

worker.on('message', (result) => {
  console.log('Result from worker:', result);
});
// worker.js
process.on('message', (msg) => {
  if (msg.action === 'compute') {
    const res = calculation(msg.value);
    process.send(res);
  }
});

function calculation(num) {
  return num * 2;
}
In this example the main application remains responsive while the heavy work goes to a separate process. However, everything had to be done manually: launching the right number of workers, distributing tasks yourself, monitoring for crashes, and all while remembering that each process consumes its own memory. As load grew, this became painful, and developers desperately needed a higher level of abstraction.
And so cluster appeared — a tool that took on the responsibility of process management.
Cluster
The cluster module became the first official way to scale a server application in Node.js. It uses child_process.fork() under the hood, but wraps it in a more convenient API, removing the headache of manual worker management from the developer.
The main feature of cluster — it allows running multiple processes that listen on the same port. This means we can bring up a server in each worker, and Node.js will distribute incoming requests between them automatically.
Additionally, cluster can:
- monitor worker status;
- restart crashed processes;
- manage their count on the fly.
Here's a simple example of how it looks:
const cluster = require('cluster');
const os = require('os');
const http = require('http');

if (cluster.isMaster) {
  const cpuCount = os.cpus().length;

  console.log(`Master started. Forking ${cpuCount} workers...`);
  for (let i = 0; i < cpuCount; i++) {
    cluster.fork();
  }

  cluster.on('exit', (worker) => {
    console.log(`Worker ${worker.process.pid} died. Restarting...`);
    cluster.fork();
  });

} else {
  http.createServer((req, res) => {
    res.writeHead(200);
    res.end(`Response from worker ${process.pid}\n`);
  }).listen(3000);

  console.log(`Worker ${process.pid} listening on port 3000`);
}
Each launched worker is a full-fledged process with its own PID, but they all respond on the same port. The master process doesn't handle requests — it simply manages the workers and ensures stability.
However, cluster has its limitations. Despite all the benefits, it works with full separate processes rather than threads, which places certain constraints on architecture and performance.
First, each worker has its own isolated memory. This means that if we want all workers to use, say, a shared cache or shared data — we can't simply create an object and share it between them. A separate exchange mechanism must be written — for example, via a file or database. This adds both complexity and latency.
Second, all communication between the master process and workers goes through serialization. When we use worker.send({ user }), the object is serialized, sent over a channel, and then deserialized on the other side. This means:
- functions, class references, closures, etc. can't be passed;
- there's overhead for packing and unpacking data;
- complex or large structures may transmit with delays.
And finally, each worker is a full process, with its own resources. It consumes memory, loads the CPU, and puts pressure on the system. Launching one worker per core is fine. But if dozens or hundreds of workers start appearing (for example, to handle each task in a separate process) — memory can run out very quickly. Unlike threads, processes don't share the heap, and every duplication of something "shared" costs additional bytes in memory.
So cluster is ideal for scaling HTTP servers across cores, but becomes less convenient when you need to:
- launch many parallel tasks;
- exchange data quickly;
- use resources economically within a single application.
That's when worker_threads comes on the scene, solving these problems by offering true multithreading inside a single process.
Worker Threads
Unlike cluster, which launches separate processes, worker_threads creates workers as threads: each has its own stack memory, but they share a heap. This allows sharing memory between threads, avoiding serialization when passing data, and generally working faster and more economically, especially with a large number of parallel tasks.
Each worker gets its own Event Loop, can execute JavaScript code independently, and return results back to the main thread. This is especially useful for heavy computations — like parsing, encryption, or report generation — that in single-threaded mode would block the entire application.
Here's an example of how it works:
// main.js
const { Worker } = require('worker_threads');

function runWorker(data) {
  return new Promise((resolve, reject) => {
    const worker = new Worker('./worker.js', { workerData: data });

    worker.on('message', resolve);
    worker.on('error', reject);
    worker.on('exit', (code) => {
      if (code !== 0) reject(new Error(`Worker stopped with code ${code}`));
    });
  });
}

runWorker(42).then((result) => {
  console.log('Result from thread:', result);
});
// worker.js
const { parentPort, workerData } = require('worker_threads');

function heavyComputation(input) {
  const start = Date.now();
  while (Date.now() - start < 2000) {}
  return input * 2;
}

const result = heavyComputation(workerData);
parentPort.postMessage(result);
In this example the main thread continues running while computations execute in the background. Threads start quickly, use less memory than processes, and allow effective parallelization of tasks. Additionally, SharedArrayBuffer can be used if shared memory between threads is needed.
Despite all the benefits, worker_threads aren't suitable for scaling HTTP servers — each thread can't listen on the same port. So for tasks related to HTTP request handling and traffic distribution, cluster remains the preferred choice.
How to Choose
Today Node.js offers several ways to parallelize work: child_process, cluster, and worker_threads. Each solves its own problem, and the choice should be based on actual needs rather than "what's trendier."
If you simply need to run an external program like ffmpeg or a Python script, child_process.spawn() or exec() will do the job. If you need to run a separate Node.js script and set up simple inter-process communication, fork() will help.
When the task is scaling a network server and using all CPU cores, cluster is the most convenient option: it automatically distributes incoming connections among workers and allows handling more traffic without extra hassle. But each worker is a full process, with separate memory and its own resource costs.
And if we're talking about heavy computations that could block the Event Loop, but spinning up a separate process for that is overkill, worker_threads is the more sensible choice. They start faster, consume less memory, and allow effective multithreading inside a single process.
But most importantly — all of these tools are probably unnecessary if the application works with I/O, databases, or APIs and doesn't hit CPU limits. Node.js handles async tasks perfectly well in single-threaded mode, and adding threads or processes "just because" is more harm than good.
Conclusions
We explored how Node.js evolved from using separate processes via child_process and fork, to the more convenient cluster, and then moved on to true multithreading with worker_threads.
In the next part we'll dive into profiling and benchmarking, so we'll know exactly when such solutions are necessary and when they're excessive.
Part 6. Profile and Measure.
We've already figured out how the Event Loop works in Node.js, how it differs from the browser version, why Node.js can't be considered a strictly single-threaded environment, and how to achieve true parallelism in code. In this final part, let's talk about how to tell when something is wrong with your application — and what to do about it.
Sometimes it seems like "everything is fine": the code runs, the server responds, there are no errors. But in reality, the Event Loop might be struggling, requests start lagging, and users start complaining. These problems aren't always obvious, especially if you're not looking deep and not measuring where exactly the application is losing time.
What to Measure and Why
A Node.js application has many different components: the Event Loop, the microtask queue, file processing, network requests, the garbage collector, and C++ modules. Any of these can become a bottleneck. And sometimes everything seems fast — until you run a load test and watch the Event Loop choke on the work.
What can actually be profiled:
- Code execution time. A simple but critical metric. Sometimes a heavy regex or loop inside a promise is all it takes for things to start lagging.
- Event Loop delays. Even if code is async, the Event Loop may not be keeping up with tasks because something blocked it at some point.
- CPU load. In Node.js, any synchronous computation runs in the main thread. This means one heavy
forloop can slow down all other requests. - Memory operations. If an application starts consuming more and more memory, you can end up with leaks and unexpected garbage collector behavior.
- Async chains. Sometimes promises or
setTimeoutare called too frequently, or too many listeners are attached. - Lingering resources. Timers, sockets, and streams that were "forgotten to close" interfere with process termination and load the Event Loop for nothing.
In this section, however, we'll focus on two key areas that affect performance from early on:
- Code execution time (CPU-bound tasks)
- Event Loop state and health
We'll see how to measure this with Node.js built-in tools and what advanced tools to use for profiling.
Basic Metrics in Node.js
Suppose we have a piece of code that's suspiciously slow for some reason. Everything seems async, but the API responds with a delay, and sometimes the server appears to freeze for a moment. To find out where time is going, let's start with the simplest thing — measuring execution time.
Let's take as our example a suspicious piece of code that uses a "harmless" regex:
const text = 'a'.repeat(20) + '!';
const pattern = /(a+)+$/;

const start = Date.now();
pattern.test(text);
console.log(`Execution time: ${Date.now() - start} ms`);
On short strings everything runs instantly. But with certain sequences, execution time can grow to tens or even hundreds of milliseconds. This is a classic example of a bad regex, which we already discussed in part three, and Date.now() lets you notice the lag. However, there's a catch: Date.now() depends on system time, which can jump — for example, if the user manually changes the time. In profiling conditions, this creates unreliability: milliseconds may "disappear" or "appear" through no fault of our code.
Instead of Date.now(), you can use the perf_hooks module, built into Node.js. It provides more stable and precise timing tools. In particular, performance.now() shows how much time has passed since the process started — ideal for measurements within a single execution.
Let's rewrite our example using perf_hooks:
const { performance } = require('perf_hooks');

const text = 'a'.repeat(20) + '!';
const pattern = /(a+)+$/;

const start = performance.now();
pattern.test(text);
const end = performance.now();

console.log(`Execution time: ${(end - start).toFixed(3)} ms`);
This approach is more reliable: it doesn't depend on system time and provides high precision. Besides performance.now(), perf_hooks also includes more advanced tools — for example, performance.mark() and performance.measure(), which let you place markers in code and then measure the distance between them, even asynchronously. This is convenient if you want to understand how long a particular processing stage takes, without cluttering code with manual calculations.
And since we're talking about the Event Loop, we can't skip monitorEventLoopDelay() — a tool that shows how much the event cycle is struggling under load.
Here's an example where the Event Loop is clearly suffering:
const { monitorEventLoopDelay } = require('perf_hooks');

const h = monitorEventLoopDelay({ resolution: 10 });
h.enable();

setTimeout(() => {
  const start = Date.now();

  // Simulate Event Loop blocking
  const now = Date.now();
  while (Date.now() - now < 300) {}

  const end = Date.now();
  console.log(`Synchronous block took: ${end - start} ms`);

  setTimeout(() => {
    h.disable();
    console.log(`Event Loop delay (mean): ${(h.mean / 1e6).toFixed(2)} ms`);
    console.log(`Event Loop delay (max): ${(h.max / 1e6).toFixed(2)} ms`);
  }, 100);
}, 100);
The result might look like this:
Synchronous block took: 300 ms
Event Loop delay (mean): 26.85 ms
Event Loop delay (max): 311.43 ms
In this example we intentionally block the Event Loop for 300 milliseconds. The measurements will show that the max delay spiked sharply, while the average (mean) may remain lower — because the rest of the time the Event Loop was breathing normally. This is a good way to catch isolated "stalls" that would otherwise go unnoticed.
However, performance.now() and monitorEventLoopDelay() have limitations: they measure time in milliseconds (albeit with high precision), and sometimes finer granularity is desired. In such cases, process.hrtime comes to the rescue.
process.hrtime returns time with nanosecond precision. It's convenient for computing relative measurements, especially in synchronous code:
const start = process.hrtime.bigint();
pattern.test(text);
const end = process.hrtime.bigint();

console.log(`Execution time: ${(end - start) / BigInt(1e6)} ms`);
Unlike performance.now(), the result needs to be divided by 1e6 to get milliseconds — but the precision is truly higher, and the influence of background processes is minimal. This approach is especially valuable when profiling a critical section of code and wanting measurements to be as consistent as possible between runs.
That said, process.hrtime is slightly less convenient to use and doesn't integrate as well with the rest of the perf_hooks tools — for example with performance.measure(). In practice, performance.now() is used more frequently for everyday tasks, while hrtime is reserved for situations requiring the highest precision.
All these measurements are, however, essentially manual work. Yes, they're useful for targeted diagnostics, but when you need to understand the overall picture, monitor Event Loop "health," or find bottlenecks in an entire application, a console.log may no longer be enough.
Tools for Analysis and Profiling
In this section we'll look at how to analyze code behavior using real profilers — from built-in tools to convenient external utilities.
For the experiments here, we'll use this demo repository: naugtur/node-example-flamegraph
It was specifically created to demonstrate Node.js application "slowdowns." Using the HOW_OBVIOUS_THE_FLAME_GRAPH_SHOULD_BE_ON_SCALE_1_TO_100 variable, you can control the load level: the higher the value, the more visible the problems in the profile.
node --prof and node --prof-process
Let's start with the lowest-level tool available in Node.js itself. This is the built-in V8 profiler, which captures execution samples and saves them to a text file.
To launch it, use two commands:
node --prof app.js
After execution, a file similar to isolate-0x*.log will be created (for example, isolate-0x158008000-59638-v8.log). It needs to be processed:
node --prof-process isolate-0x158008000-59638-v8.log > processed.txt
The result is a report showing which functions took the most time, how often they were called, and what the CPU call stack looked like.
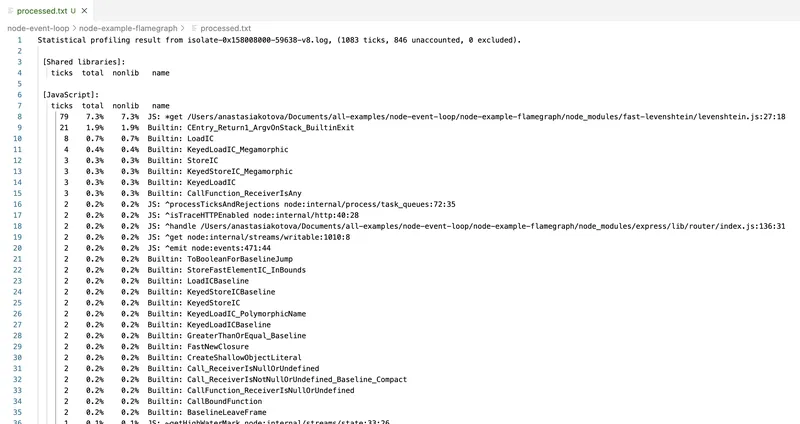
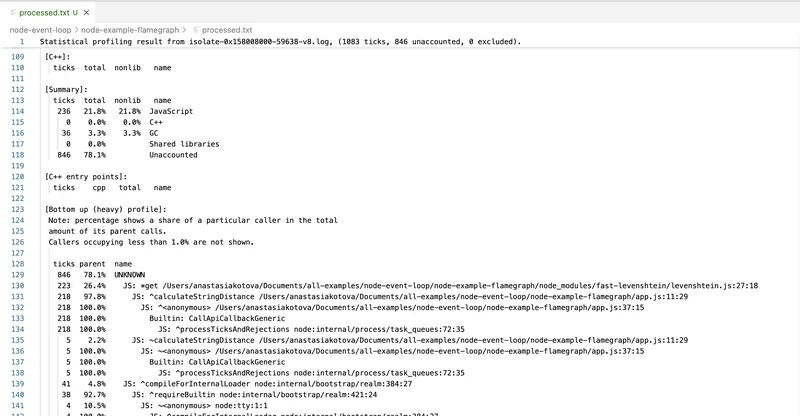
This tool uses V8's own internals and shows a raw execution profile, including C++-level calls. However, it has downsides.
First, the interface is practically unreadable. All function names are mixed with internal calls. Second, there are no visualizations — only text. Parsing the profile requires considerable willpower, or using wrappers like 0x.
0x: Fast Flamegraphs Without the Pain
0x is a wrapper around --prof that does everything the same, but with visualization. It runs the code, collects the profile, and automatically generates an HTML file with a flamegraph.
Example run:
0x app.js
After execution we get flamegraph.html, where we can visually see which function spent how much time on the CPU. The width of each block is proportional to time — the wider, the longer the code ran.
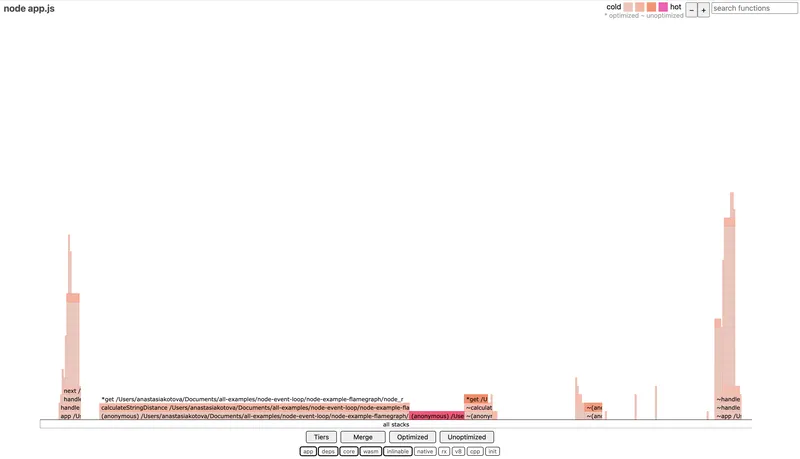
0x is convenient for analyzing CPU-bound sections — heavy loops, computations, problematic regexes. It doesn't show async dependencies, but it's perfect when you need to quickly understand where exactly the CPU is "burning."
clinic: A Full Health Check
clinic is a set of utilities that includes clinic flame, clinic doctor, and clinic bubbleprof. Here we're interested in clinic flame — it does roughly the same as 0x, but with slightly more detailed visualization and a convenient wrapper.
Command to run:
clinic flame -- node app.js
When finished, an HTML report with a flamegraph will open. You can click on functions, view call stacks, zoom in on sections, and save output.

The difference from 0x is slightly more information in the visualization and compatibility with the rest of the clinic tools.
When it's not entirely clear what's slowing things down — the CPU, the Event Loop, or something with memory — it's convenient to start with more general diagnostics. For this there's clinic doctor. It collects several types of metrics simultaneously: CPU load, Event Loop delays, memory usage, incoming request frequency, etc.
Command:
clinic doctor -- node app.js
After launching, you need to interact with the application a bit (for example, open the server page in a browser or make requests via curl), and then stop the process — the report will open automatically.
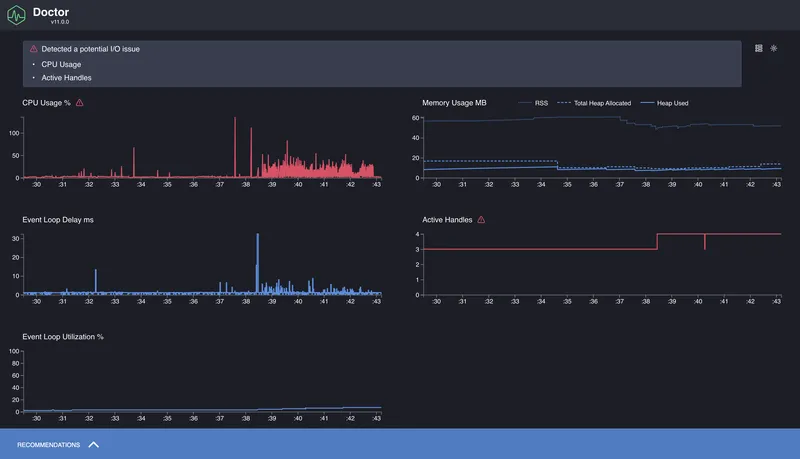
The output gives an overall picture: how uniform the load is, whether there are Event Loop delays, how memory behaves.
What is a Flamegraph and How to Read It
We've seen how to use 0x and clinic flame, and got a result in the form of a graph where everything is highlighted and arranged in levels. At first glance it might look like just a pretty report, but a flamegraph is actually a powerful performance analysis tool.
A flamegraph is a visualization of the code execution profile. Each function in the call stack is displayed as a rectangle. The width of the block shows how much time that function spent on the CPU. The wider the block — the more time it "consumed." All blocks fit within the overall width of the graph, which represents the total CPU load during the profiling period.
The graph "grows" from bottom to top. The bottom blocks are where the call stack started. The top blocks are what was called inside them. If a particularly wide stripe appears at a lower level, it's a clear sign of a bottleneck: the function runs frequently and/or for a long time, and blocks other actions.
Important: a flamegraph only shows what was happening on the CPU. Async delays, waits, promises, timers — anything that wasn't consuming CPU — won't appear in the flamegraph. This makes it an ideal tool for finding synchronous stalls, but an incomplete one — which is precisely why clinic includes other tools like doctor and bubbleprof.
The flamegraph reports themselves are interactive: you can zoom in, search by function name, view call stacks. This is especially useful when analyzing large projects where the stack can go dozens of levels deep.
Conclusions
In this part we figured out how to approach profiling Node.js applications: what to measure, which tools to use, and how to interpret the results. We looked at how to measure execution time with performance.now() and process.hrtime, how to track Event Loop delays via monitorEventLoopDelay(), and how to use profilers — from the built-in --prof to 0x and clinic.
The flamegraph format turned out to be especially useful for identifying synchronous bottlenecks: heavy regexes, blocking loops, and anything that consumes too much CPU. And clinic doctor gave us a broader picture: overall Event Loop behavior, load, memory, request frequency.
This is just the foundation. Beyond it lies an entire layer of topics to explore further: production profiling, load testing, memory management and leaks, async performance.